
Spotlight Feature: Dami Akinleye on The Analytics Skills Every Modern Marketer Should Have
Dami Akinleye, Digital Anaytics Tutor at NowSkills is a marketing and data analyst focused on helping teams turn data into clear, practical decisions. She works at the intersection of measurement, reporting, and storytelling by bridging the gap between marketing goals and the numbers behind them. She enjoy making analytics accessible to non-technical teams so insights don’t get stuck in dashboards.
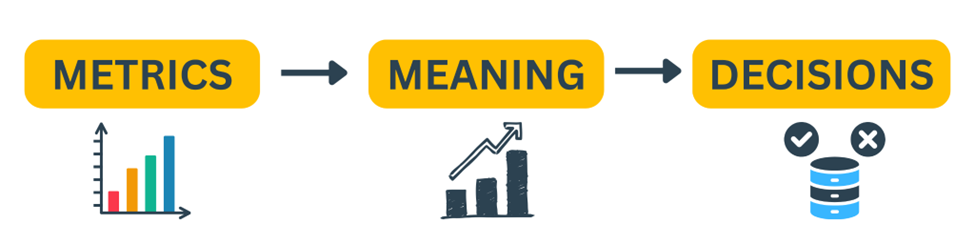
Marketing has never had more data… and yet it’s never been harder to confidently answer simple questions like “what’s working?” or “where should we increase ad spend?” Most marketing data is ‘fine’; however, the skill gap is in interpreting this data and turning it into actions the business can trust.
The significance of collecting the right data, analysing it and getting the right insights from the data cannot be overstated. This process improves the quality of marketing decisions and also provides the evidence needed to support them when communicating these decisions to the relevant stakeholders.
The big question is, ‘How are marketers using data analysis today to make an impact?’
Between privacy changes, messy attribution, and more channels than any human brain should manage, marketers are being pushed to make bigger decisions with less certainty, and that’s exactly why analytics skills matter now.
In this article, she’ll break down the core analytics skills every modern marketer should build, the common mistakes that quietly sabotage performance, and a simple 30-day plan to start improving immediately.
Data-driven Marketing amid Privacy Challenges
Why analytics is now a core marketing skill (no longer “a nice to have”)
Businesses nowadays generate a vast amount of data from sales, CRM, and other sources. Consequently, marketers must be dynamic and rely on data to make informed, effective decisions.
Marketers are accountable for ROI and growth decisions. Gone are the days when marketers relied on instinct, things that worked in the past, and stakeholders’ emotions when carrying out marketing activities. They’re now responsible for checking the ROI to ensure maximum returns on ad spend and decisions on where to focus marketing efforts.
While we still have tools that help us measure performance, tracking isn’t as simple or as complete as it used to be. With privacy changes and less reliable attribution, it’s more important than ever to think clearly about what success looks like, how we measure it, and what decisions we’ll make from the results. Analytics skills help marketers connect activity to outcomes, so performance conversations aren’t based on instinct, noise, or the loudest opinion in the room.
Core Data Skills for Modern Marketers
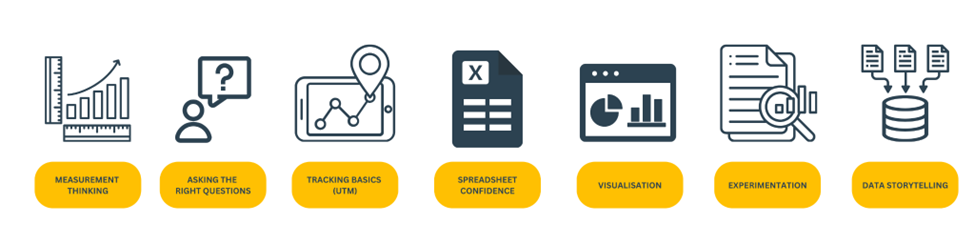
The core analytics skills every modern marketer should have
Marketing teams that can interpret data win faster in this day and age because that means they can execute much faster and make iterations based on the data they receive. Marketers who are able to analyse data, therefore, are very valuable to teams and help the businesses achieve their marketing goals. These are the core skills every modern marketer should have:
1) Measurement thinking: Goal → Metric → Decision
Measurement thinking is the habit of starting with the business goal, choosing the right metric to track it, and deciding in advance what action you’ll take based on the result. It’s essentially checking “why are we measuring this?” before opening a dashboard.
It’s an important skill because otherwise you end up with reports full of numbers that don’t change anything. If a metric doesn’t connect to a decision, it becomes noise, and teams start performing for the dashboard instead of improving outcomes. Here’s how to build this skill:
- Before any campaign, write one sentence: For instance, “If cost per lead is below £15, we’ll increase budget by 20%.”
- Create a simple metric hierarchy: Have one primary success metric + 1 or 2 supporting metrics (e.g., CPL + conversion rate + revenue).
2) Asking the right questions
It’s turning vague requests like “can you pull the numbers?” into decision-focused questions like “which channel brought the highest-quality leads last month and why?” It helps marketers avoid analysing the wrong things because analysis is expensive, not just in terms of money, but also in time and attention. The fastest way to waste both is answering the wrong question beautifully.
- Ask the question, “What decision are we trying to make?” then work backwards into the data you need.
- Instead of asking, “How did we do?”, ask these instead:
- “What changed?”
- “What caused it?”
- “What should we do next?”
3) Tracking basics
This means you can reliably tell where users came from, what they did, and what counts as success by using consistent UTMs, event tracking, and shared definitions within the team. If tracking is messy, your best analysis will still be shaky. And when leaders sense the data is unreliable, they stop trusting analytics altogether. To do this effectively,
- Create a one-page UTM naming guide (source/medium/campaign) and stick to it.
- Keep a shared definitions doc: Lead / Enquiry / Sale — one team, one language.
4) Spreadsheet confidence (Microsoft Excel/Google Sheets)
Being able to clean, summarise, and spot patterns in data quickly without needing a BI tool for everything. Spreadsheets are still the fastest way to answer “what’s going on?” in real life. When marketers can sanity-check data themselves, decisions happen faster, and the analytics team isn’t stuck doing basic pulls all day.
How to build it:
- Learn some essentials: Pivot tables & charts, Basic formulas & functions, and date handling.
- Create a reusable template: weekly performance table + pivot table + chart + insights.
5) Visualisation
Simple visualisation is using charts to make the message instantly obvious. The goal isn’t to show everything; it’s to make the insight hard to miss. Good visualisation helps people grasp the point in seconds, which is exactly what decision-makers need. Some relevant BI tools are Looker Studio, Power BI and Tableau.
- Title charts with the conclusion (e.g. Referrals convert 3x better than Paid Ads).
- Use fewer charts, clearer labels, and one comparison: (e.g. This month vs Last month). For example, a simple funnel chart showing Leads → Enquiries → Sales often tells a clearer story than a full dashboard screenshot.
6) Experimentation fundamentals
The use of A/B tests and experimentation helps marketers learn what actually improves results, not just launching and hoping. Experimenting means you define a hypothesis, pick a success metric, and compare outcomes fairly. This helps you separate what worked from luck and it’s important because multiple factors can affect outcomes such as seasonality, creative fatigue, algorithms and platform changes.
- Write a hypothesis: “If we change X, then Y will improve because Z.”
- Pick: one primary metric (e.g., conversion rate) + one guardrail (e.g., cost per acquisition).
7) Data storytelling
This is when numbers turn into action, and making sure to tell a clear story that connects the data to a decision. This is not reporting the data but explaining what it means and what to do. The best analysis can still fail if it’s communicated badly. Storytelling is what turns insights into buy-in, budget, and action from relevant stakeholders.
Always add an owner and timeframe: “Sales ops to tag lead source for 2 weeks; review next Friday.”
Use What / So what / Now what structure every time:
What: “Leads are up 20%, but enquiries are down 10%.”
So what: “We’re attracting more low-intent leads or follow-up is slower.”
Now what: “Break down by source + check response time this week.”
Common Marketing Analytics Mistakes and Fixes
The most common mistakes (and how to fix them quickly)
Even strong marketing teams can get tripped up by a few “small” mistakes that quietly ruin analysis. The good news is these fixes are simple, so once you implement them, your data becomes easier to trust, and your insights become easier to act on.
- Vanity metrics (optimising clicks when revenue is the goal)
It’s easy to celebrate high impressions, likes, or click-through rates, but if those numbers don’t connect to leads, enquiries, or sales, you’re basically clapping for activity.
The fix is to ensure you define success before launch: one primary metric (e.g., cost per enquiry or CPA) + 1 or 2 supporting metrics (e.g., conversion rate, revenue). That way, everyone knows what good metrics actually look like for the campaigns. - Unclear definitions (people are measuring different things)
This can occur when one person’s “lead” is another person’s “enquiry,” and suddenly your weekly performance report becomes a debate instead of a decision. This is one of the fastest ways to lose trust in data across teams.
Create one shared definitions sheet that clearly explains what counts as a Lead, Enquiry, Qualified Lead, and Sale, and use it everywhere (reports, dashboards, meetings).
- Broken tracking plans (inconsistent UTMs, missing events, messy attribution)
If tracking is inconsistent, your analysis becomes shaky no matter how good the dashboard looks. You’ll see weird spikes you can’t explain, missing conversions, and unknown traffic that makes decisions feel like guesswork.
Have a ready-made simple tracking checklist (UTM rules, event naming, who owns implementation) and a naming convention that everyone follows. Consistency is more valuable than complexity. - Dashboards without decisions (reporting without action)
A dashboard can look impressive and still do nothing. If the report ends with, here are the numbers, and no next step, it becomes background noise, and people stop paying attention.
Let every report end with a “Now what?” section: one recommendation, one owner, and when you’ll review impact. Insights that don’t lead to action end in the meeting notes.
Simple Four-Week Marketing Analytics Action Plan
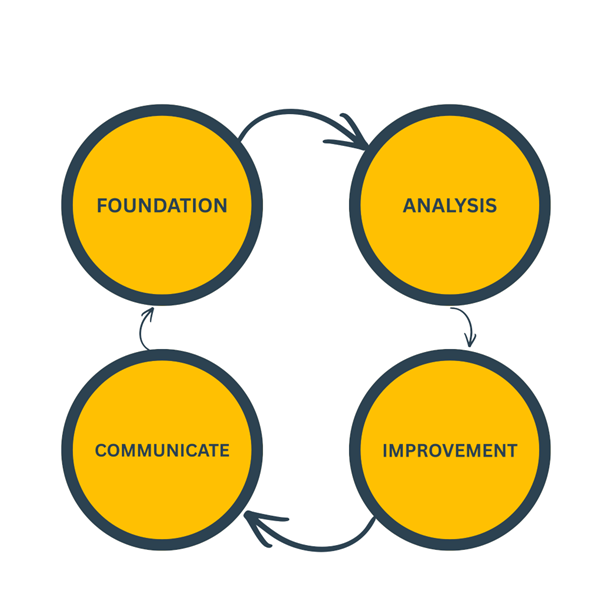
Your next 30 days: a practical action plan
If you’re reading this thinking “okay… but where do I actually start?”, here’s a simple 4-week plan you can follow without needing a new tool, a new hire, or a full analytics overhaul. The goal is to build the habits that make your data more reliable and your decisions more confident.
Week 1: Foundations
This week is about setting yourself up to trust the numbers so you can get clarity before you start analysing anything.
- Write a 1-page measurement plan for one campaign. Keep it simple: objective, audience, channel, success metric, and what you’ll do if results are strong vs weak.
- Agree definitions + a tracking checklist. Align on what counts as a lead, enquiry, and sale, and make sure UTMs/events follow one naming convention.
Week 2: Analysis
Now you can start looking at the numbers with structure instead of guesswork to find the real story.
- Build one simple report that shows your funnel (e.g., Leads → Enquiries → Sales) plus a source breakdown (where your best leads are actually coming from).
- Identify one bottleneck. Don’t try to fix everything, pick the biggest drop-off or the one stage slowing down results.
Week 3: Improvement
This is where you test one change that could move the needle so you go from “reporting” to “improving.”
- Pick one change to test based on your Week 2 bottleneck (e.g., landing page clarity, targeting, messaging, or follow-up speed).
- Set your metrics upfront: Have one primary metric (the main success measure) and one guardrail metric (to make sure you don’t improve one thing while harming another).
Week 4: Communicate
Your analysis only matters if it leads to action that stakeholders can commit to.
Make a decision: Scale what worked, stop what didn’t, or iterate with one new test, and then repeat the loop next month.
Present the results using What / So what / Now what. Keep it short, clear, and decision-led.
Final thoughts
You don’t need perfect data to be a strong marketer; you just need a consistent way of thinking about data. When you get clearer on what you’re trying to achieve, ask better questions, and measure what actually connects to outcomes, your decisions become faster, and your results become easier to explain and defend.
Start small: tighten one tracking habit, improve one report, test one change. Those small improvements compound quickly, and over time, you’ll find that the biggest advantage isn’t having more data, it’s knowing exactly what to do with the data you already have.
I’d love to hear how you’re building analytics skills in your team, connect with me on LinkedIn and let’s keep the conversation going: https://www.linkedin.com/in/dami-akinleye/
Join Us Now!
Ready to elevate your marketing strategy? Be part of our 2026 summits – where innovation, networking, and cutting-edge insights meet in vibrant cities around the world. We can’t wait to welcome you in person!
Can’t attend in person? No problem. Join BEETc On-Screen, our On-Demand Learning Platform, for exclusive access to 500+ sessions and over 300 hours of content from global summits. Upskill at your own pace, gain actionable insights, and stay ahead in a rapidly evolving business landscape.
⭐ Register now! Yearly & Monthly Passes available!
BEETc On-Screen, our On-Demand Learning Platform, where you can find all the previous sessions of The MarTech Summits, exclusive BEETc On-Screen Webinars and more!
⭐Use code PSR1MON to register now and enjoy 1 month of free access. Catch up, revisit, and discover fresh perspectives at your own pace.
See more MarTech Thoughts interview pieces here!
Stay up to date with our In Person Summit, Session Information, and Agenda Updates by following us on:
Last updated:February 2026